Spreadsheets do not scale
Shared tabs drift out of sync, formulas break silently, and no one is sure which version holds the number the forecast is built on.
Generated files, runtime feedback, previews, and release controls stay in one workspace.
Dashboard Builder ready for your data
Describe the KPIs, the pipeline view, and the filters you need. E-Code turns that into a data-rich dashboard in editable source code. Inspect every file, run it in Preview, refine it through the Agent, and extend the code to connect your own data and team access.
Start from the metrics you already track. Source files, the running Preview, and the chart and filter components stay visible as the dashboard evolves.
 Open live preview
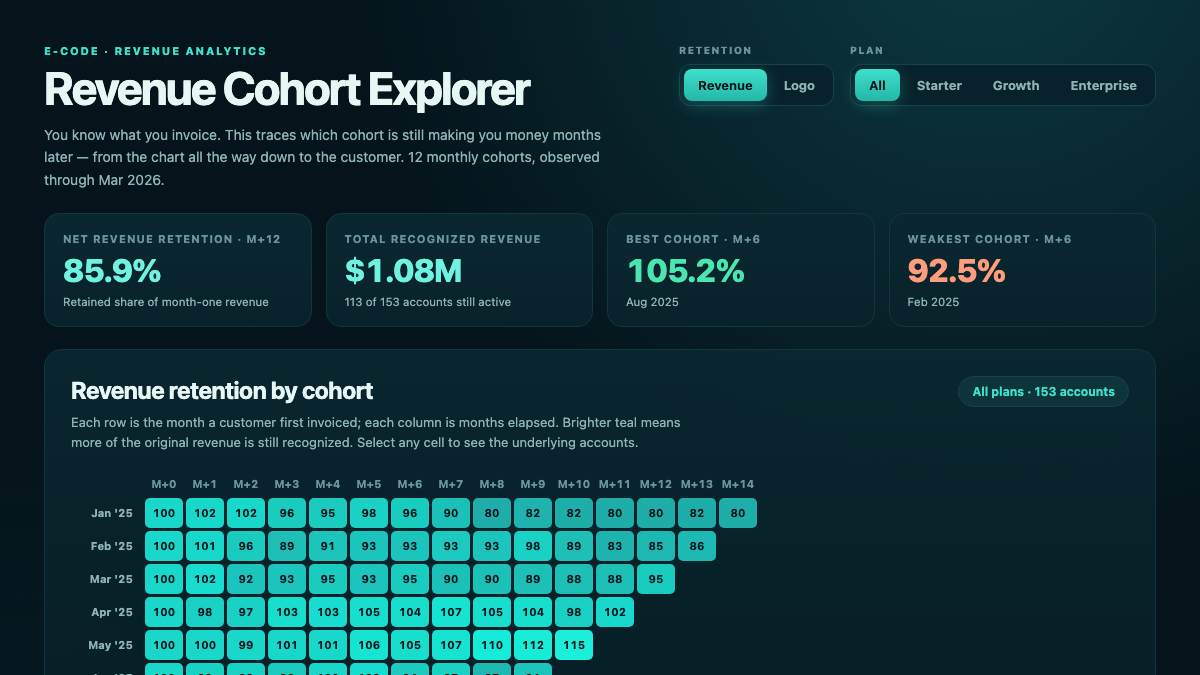
A certified analytics app with filters, computed KPIs, cohort drill-down, and customer detail.
REAL APPS · OPEN THE PREVIEW
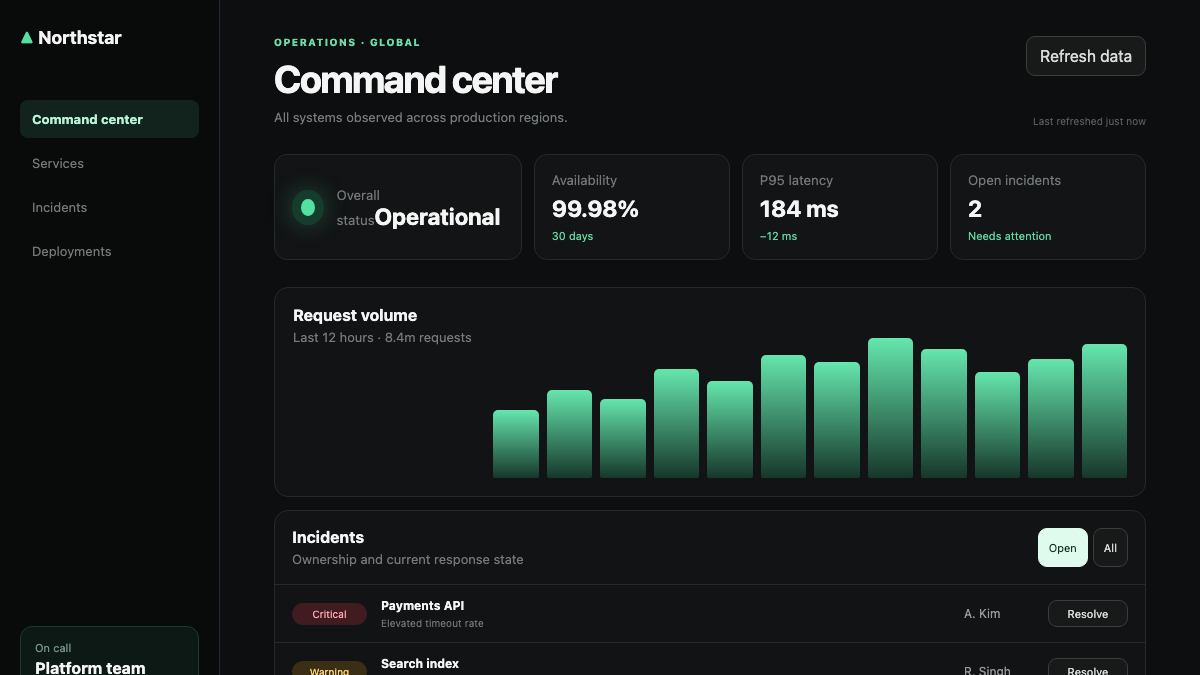
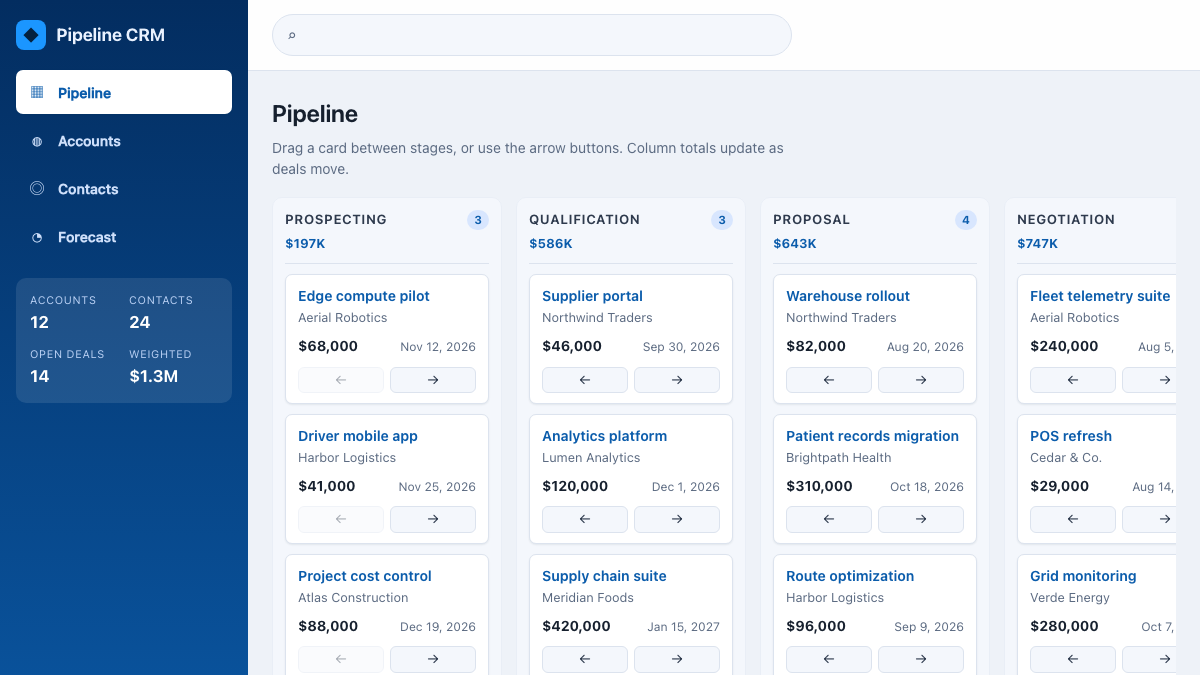
Every image below is a capture of an executable E-Code demo application. Open the preview to test the interface yourself.
 Open live preview
A production operations dashboard with service health, incident ownership, and deployment status.
 Open live preview
A certified sales application with movable opportunities, live totals, search, and forecasting.
From spreadsheet sprawl to an inspectable dashboard
A revenue team needs one view of the numbers that every rep and manager trusts. Spreadsheets and generic BI tools start fast, then fracture into tabs, break on refresh, and never become a real interface the team can shape.
Shared tabs drift out of sync, formulas break silently, and no one is sure which version holds the number the forecast is built on.
Generic dashboards constrain how KPIs, tables, and filters fit together, and the moment you need a custom view you are fighting the tool.
When the reporting layer lives inside a closed platform, connecting your own data, auth, and access rules waits on someone else and stays out of your hands.
E-Code starts from the KPIs and views you describe and produces a dashboard in real source files. You inspect the components, run it in Preview, and extend the code to connect your data and team access.
One prompt starts the dashboard
The request below reads like a note from a sales leader. The four items map its implementation scope in real source files, not a locked BI template.
Build a dashboard for my sales, connected to my database, with charts and filters.
Metric tiles, charts, and trend indicators render across desktop, tablet, and mobile from real components you can read and restyle.
An opportunities table with sortable columns and filters is modeled as editable code the team can extend without breaking the layout.
The dashboard scaffolds sign-in and role-aware access as real code you extend to your identity provider and access rules.
E-Code runs the dashboard in Preview across screen sizes with fictional data. Connecting a real data source is code you extend; the project stays exportable for any host.
What you receive
The project stays inspectable from the first generated file through Preview and export. The charts, tables, filters, and access scaffolding are real code you extend to your own data — no hidden BI layer.
Chart components, table logic, filters, routes, and styles remain readable, versionable, and exportable instead of disappearing inside a BI layer.
Fields, sample records, query boundaries, and adapters stay visible in code. Replace the fictional pipeline data by wiring your database or API, and connect identity separately.
Open KPIs, pipeline rows, charts, and filters in the running Preview and inspect their behavior across desktop, tablet, and phone layouts.
A dashboard frontend that qualifies as a supported static build can move through E-Code’s guided publishing flow after review.
Supported static dashboards receive an E-Code live URL after publishing. Projects that require server queries or protected APIs stay exportable for deployment with their runtime.
Keep talking to the Agent to add a KPI, segment, or drill-down, then compare the updated code with the dashboard still running in Preview.
Built for real data dashboards
The Dashboard Builder path keeps metrics, tables, filters, and access in one inspectable workflow.
Metric tiles, line and bar charts, and trend indicators as editable components.
Date ranges, owners, and stage filters that narrow every view together.
Sortable, paginated tables for opportunities and detail records.
Sign-in and role-aware access scaffolded as code you extend to your provider.
Layouts adapt from wide desktop to phone without a separate mobile build.
Export the project and connect your data while keeping the source and query code editable.
Who builds with it
From a sales pipeline to an ops control room, the same loop produces a real, responsive dashboard.
Pipeline, forecast, and win-rate views for reps and managers.
Status boards for delivery, support, and service metrics, ready to wire to operational data.
Budget, spend, and cash dashboards with filters and drill-downs.
Role-aware tables and metrics for teams managing their own records.
Common questions
What the Dashboard Builder path produces, and where its boundaries are.
You get editable source files — components, routes, charts, and tables — that you can read, version, and export. There is no proprietary dashboard lock-in.
No. The inline demonstration on this page uses fictional data and no connected backend. Connecting a real data source is code you extend, wired to your own database or API.
The build scaffolds sign-in and role-aware access as real code. Wiring it to your identity provider and enforcing your access rules is code you extend.
Yes. Layouts are generated to adapt across desktop, tablet, and mobile, and you verify them in Preview at each size.
Edit the files directly or ask the Agent for the next metric, table, or filter and review the diff against the running Preview.
Dashboard Builder ready for your data
Turn the KPIs and views you have in mind into a data-rich dashboard in real source code, run it in Preview, and extend it to connect your own data and team access.